Accurately render even the largest data
New to Datashader? Check out this quick video introduction to what it does and how it works!
Datashader is a graphics pipeline system for creating meaningful representations of large datasets quickly and flexibly. Datashader breaks the creation of images into a series of explicit steps that allow computations to be done on intermediate representations. This approach allows accurate and effective visualizations to be produced automatically without trial-and-error parameter tuning, and also makes it simple for data scientists to focus on particular data and relationships of interest in a principled way.
The computation-intensive steps in this process are written in ordinary Python but transparently compiled to machine code using Numba and flexibly distributed across CPU cores and processors using Dask or GPUs using CUDA. This approach provides a highly optimized rendering pipeline that makes it practical to work with extremely large datasets even on standard hardware, while exploiting distributed and GPU systems when available.
For concreteness, here’s an example of what Datashader code looks like:
import datashader as ds, pandas as pd, colorcet
df  = pd.read_csv('census.csv')
cvs = ds.Canvas(plot_width=850, plot_height=500)
agg = cvs.points(df, 'longitude', 'latitude')
img = ds.tf.shade(agg, cmap=colorcet.fire, how='log')
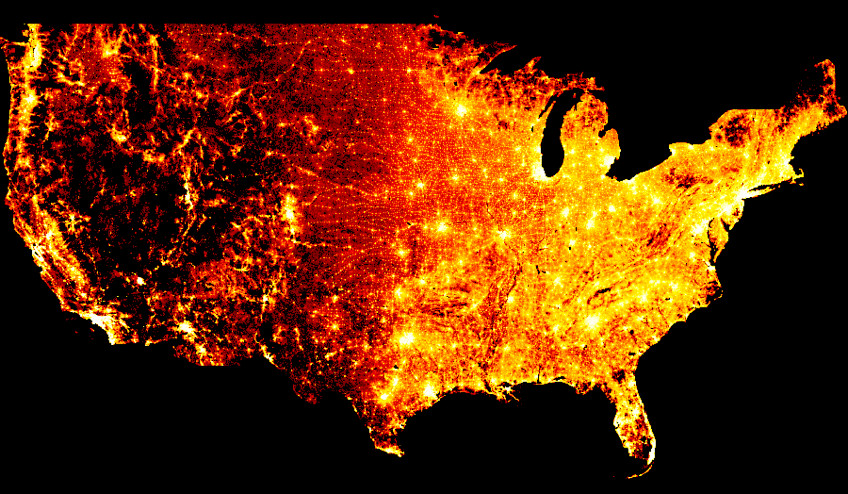
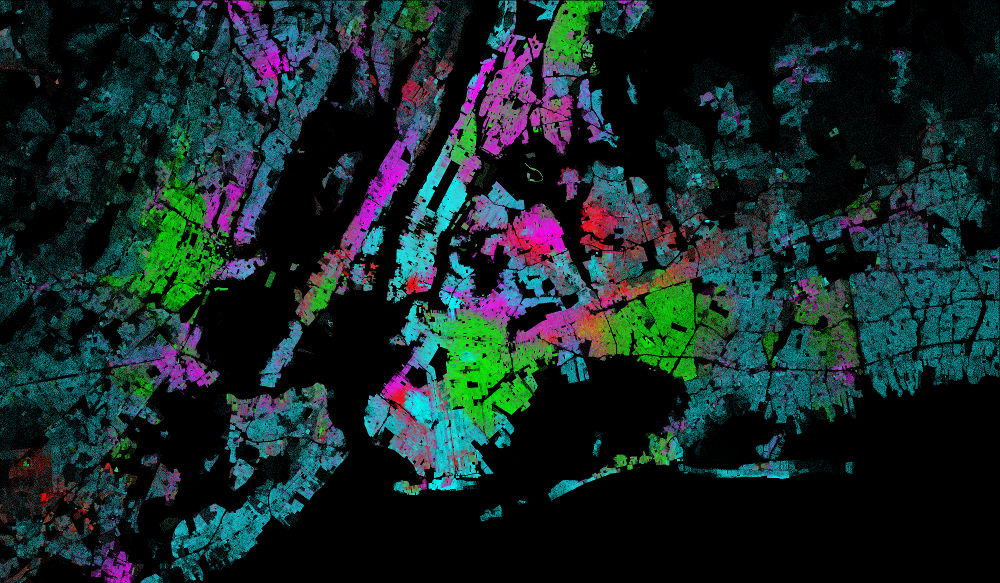
This code reads a data file into a Pandas dataframe df, and then projects the fields longitude and latitude onto the x and y dimensions of an 850x500 grid, aggregating it by count. The results are rendered into an image where the minimum count will be plotted in black, the maximum in white, and with brighter colors ranging logarithmically in between.
With code just like the above, you can plot 300 million points of data (one per person in the USA) from the 2010 census without any parameter tuning:
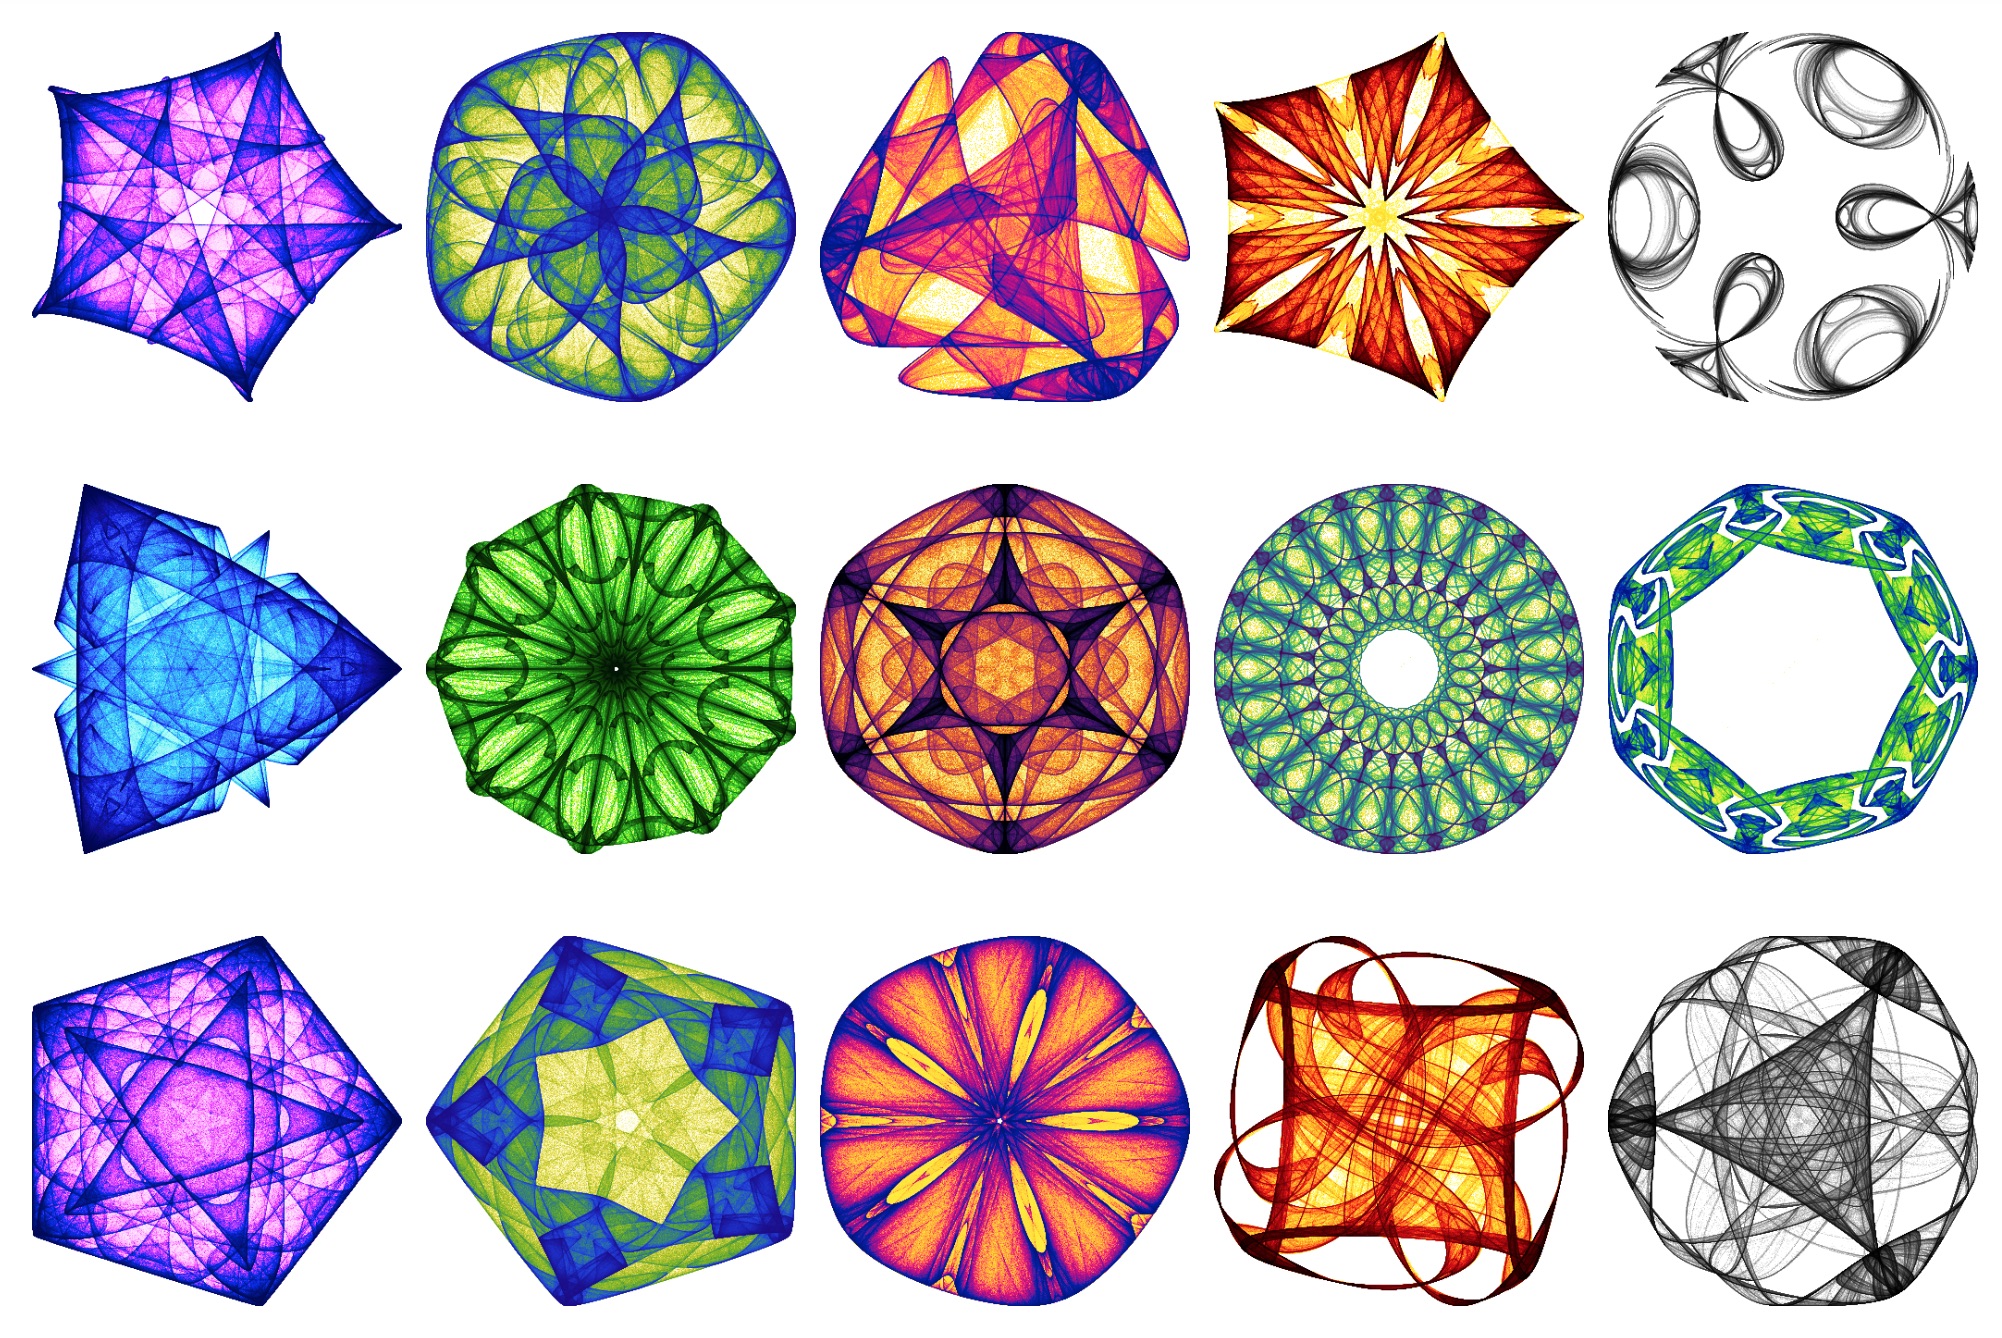
Or you can plot attractors with 10 million points each, using random colormaps:
Installation#
Please follow the instructions on Getting Started if you want to reproduce the specific examples on this website, or follow the instructions at HoloViz.org if you want to try out Datashader together with related plotting tools.
Other resources#
You can see Datashader in action in the 2019 HoloViz SciPy tutorial (3 hours!), listen to the Open Source Directions episode from July 2019, or see how it is used in many of the projects at examples.pyviz.org.
Some of the original ideas for Datashader were developed under the name Abstract Rendering, which is described in a 2014 SPIE VDA paper.
The source code for datashader is maintained on Github, and is documented using the API link on this page.
We recommend the Getting Started Guide to learn the basic concepts and start using Datashader as quickly as possible.
The User Guide covers specific topics in more detail.
The API is the definitive guide to each part of
Datashader, but the same information is available more conveniently via
the help() command as needed when using each component.
Please feel free to report issues or contribute code.